
Prescriptive Market Intelligence
Not just charts and news — a terminal that tells you where price is likely headed, when to expect the turn, and which setups have an edge. Powered by the Kellan Projection (%K), our proprietary projection method.
One terminal. The whole edge.
Every tool you need to read the tape, time the turn, and act with conviction — built around models you won't find anywhere else.
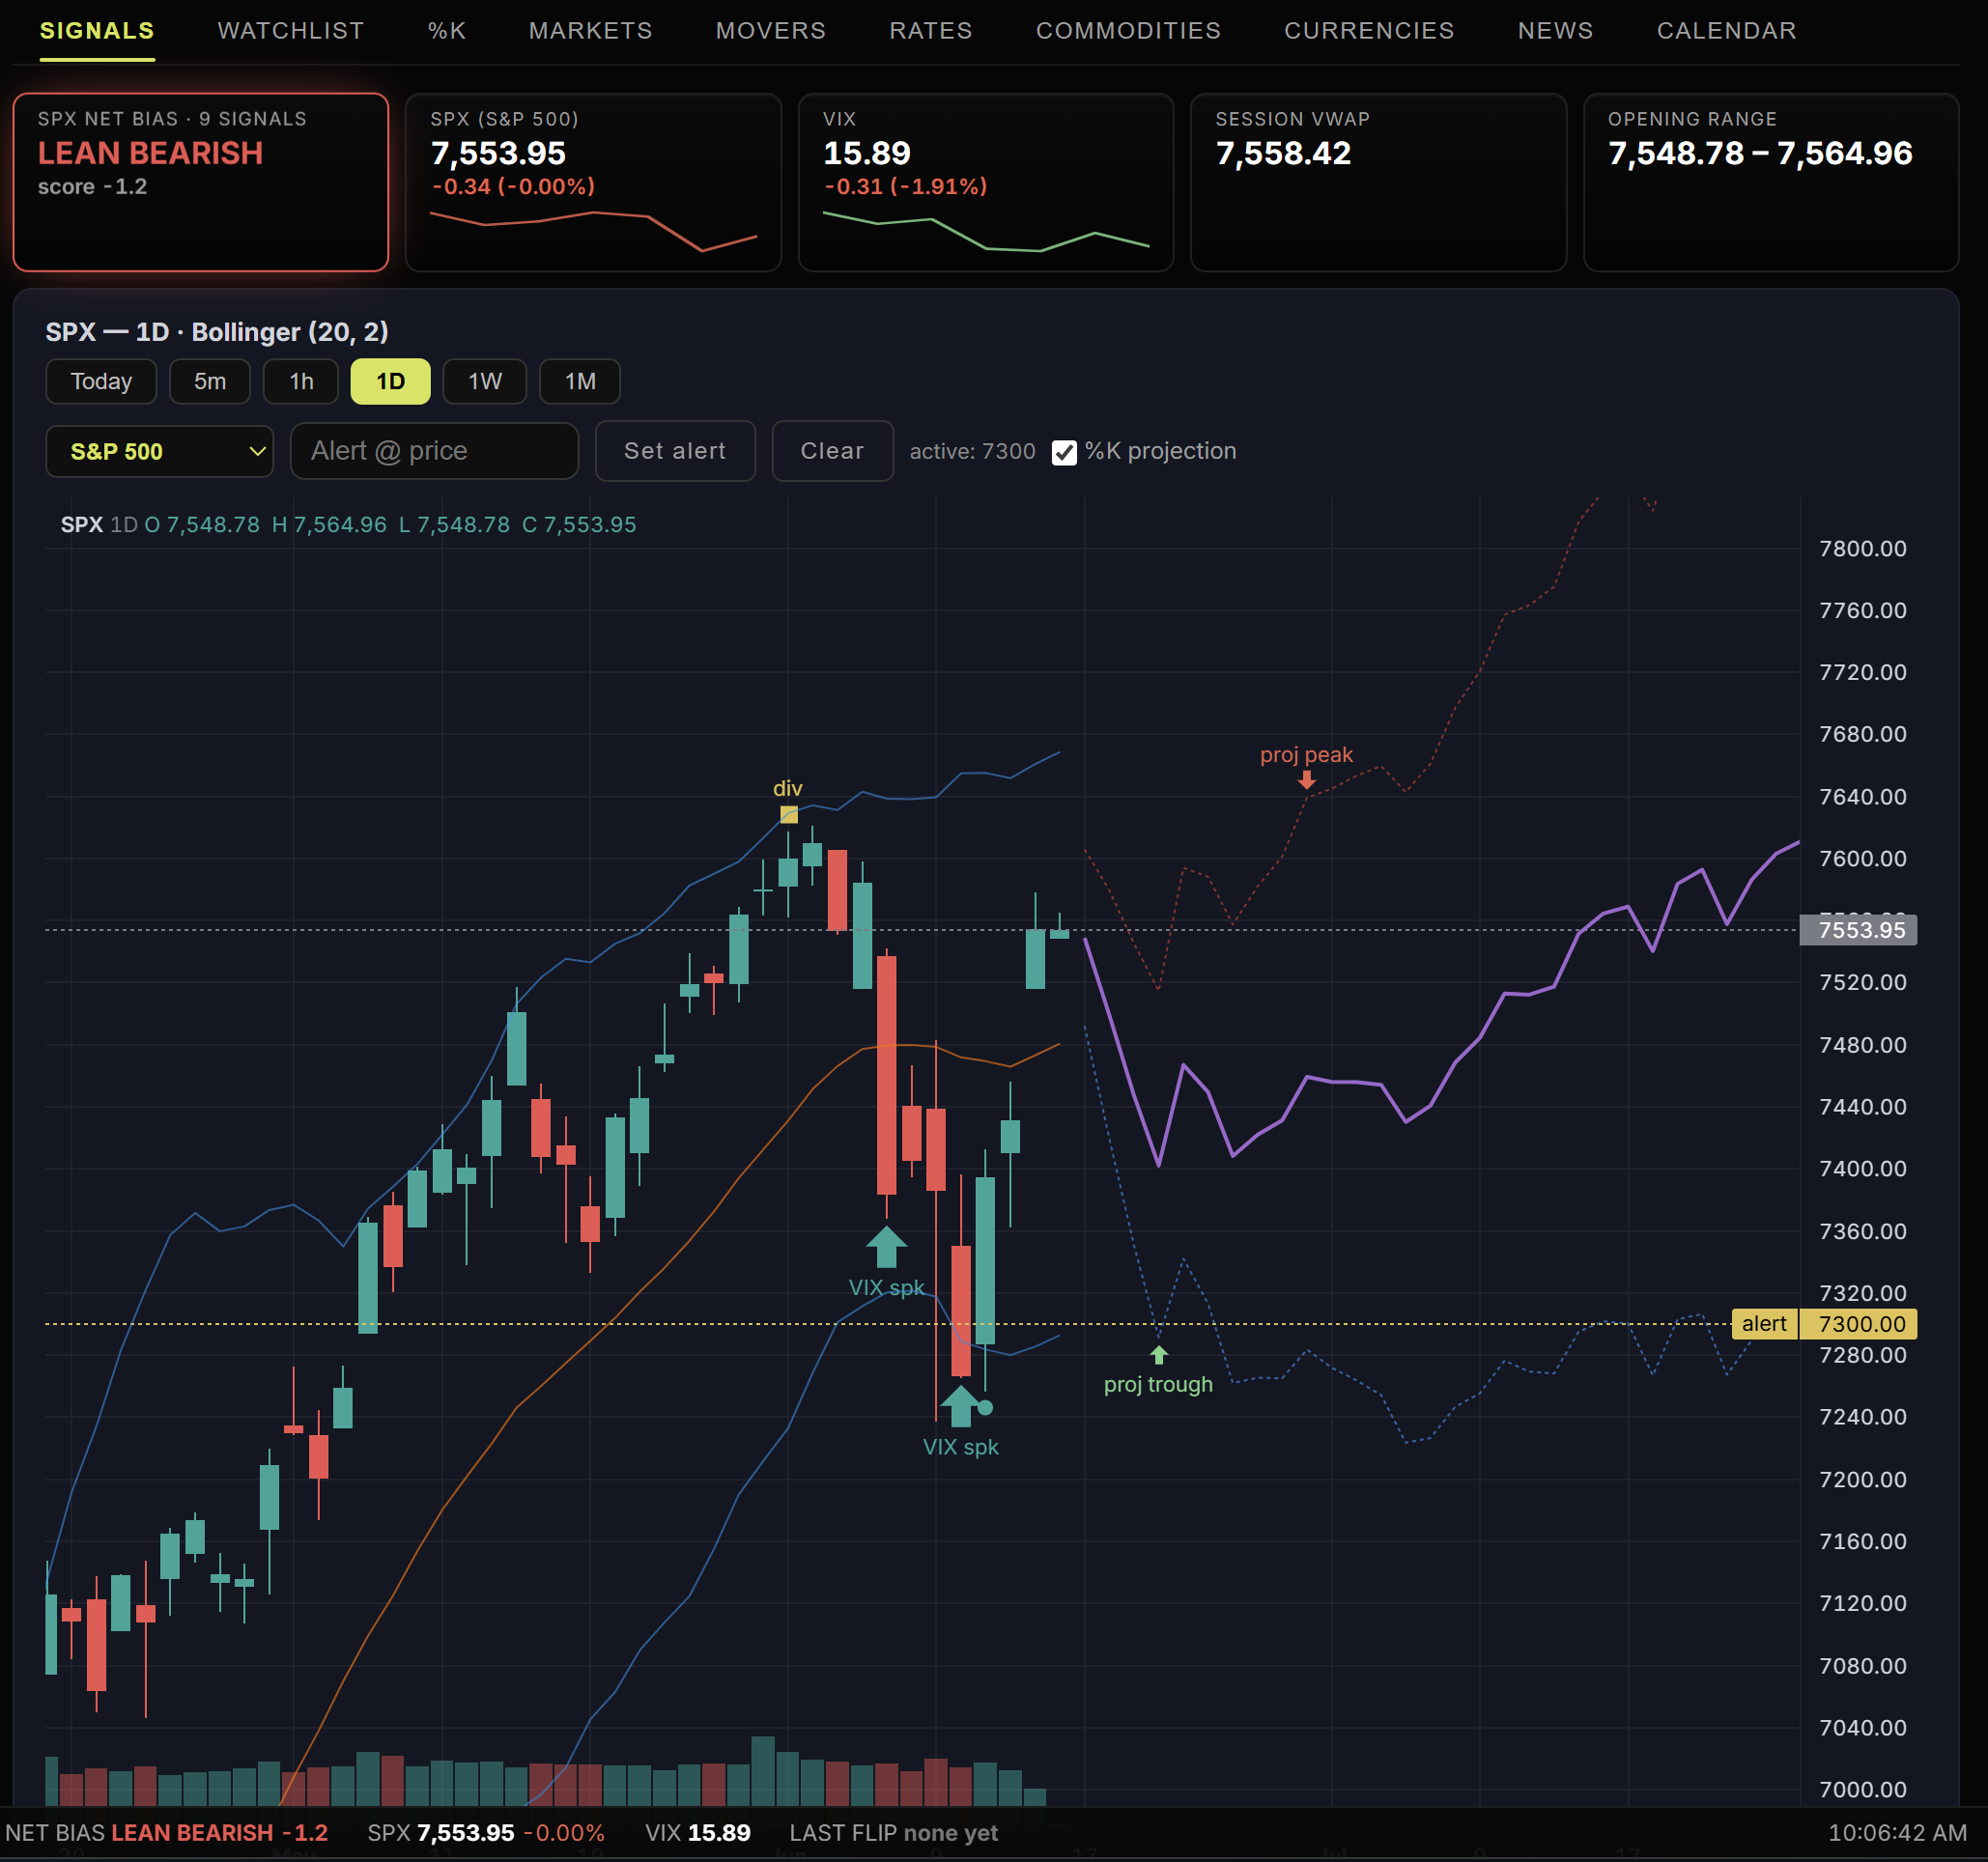
Know the lean before you trade
The Signals dashboard distills VIX behavior, volatility regime, opening range, prior-day levels and divergences into a single Net Bias read — bullish to bearish — with a multi-timeframe alignment check so you know when conviction is high and when to stand down.
- Tactical net-bias meter with regime alignment
- Live candlesticks with Bollinger Bands, VWAP & signal markers
- Plain-English callouts on every signal
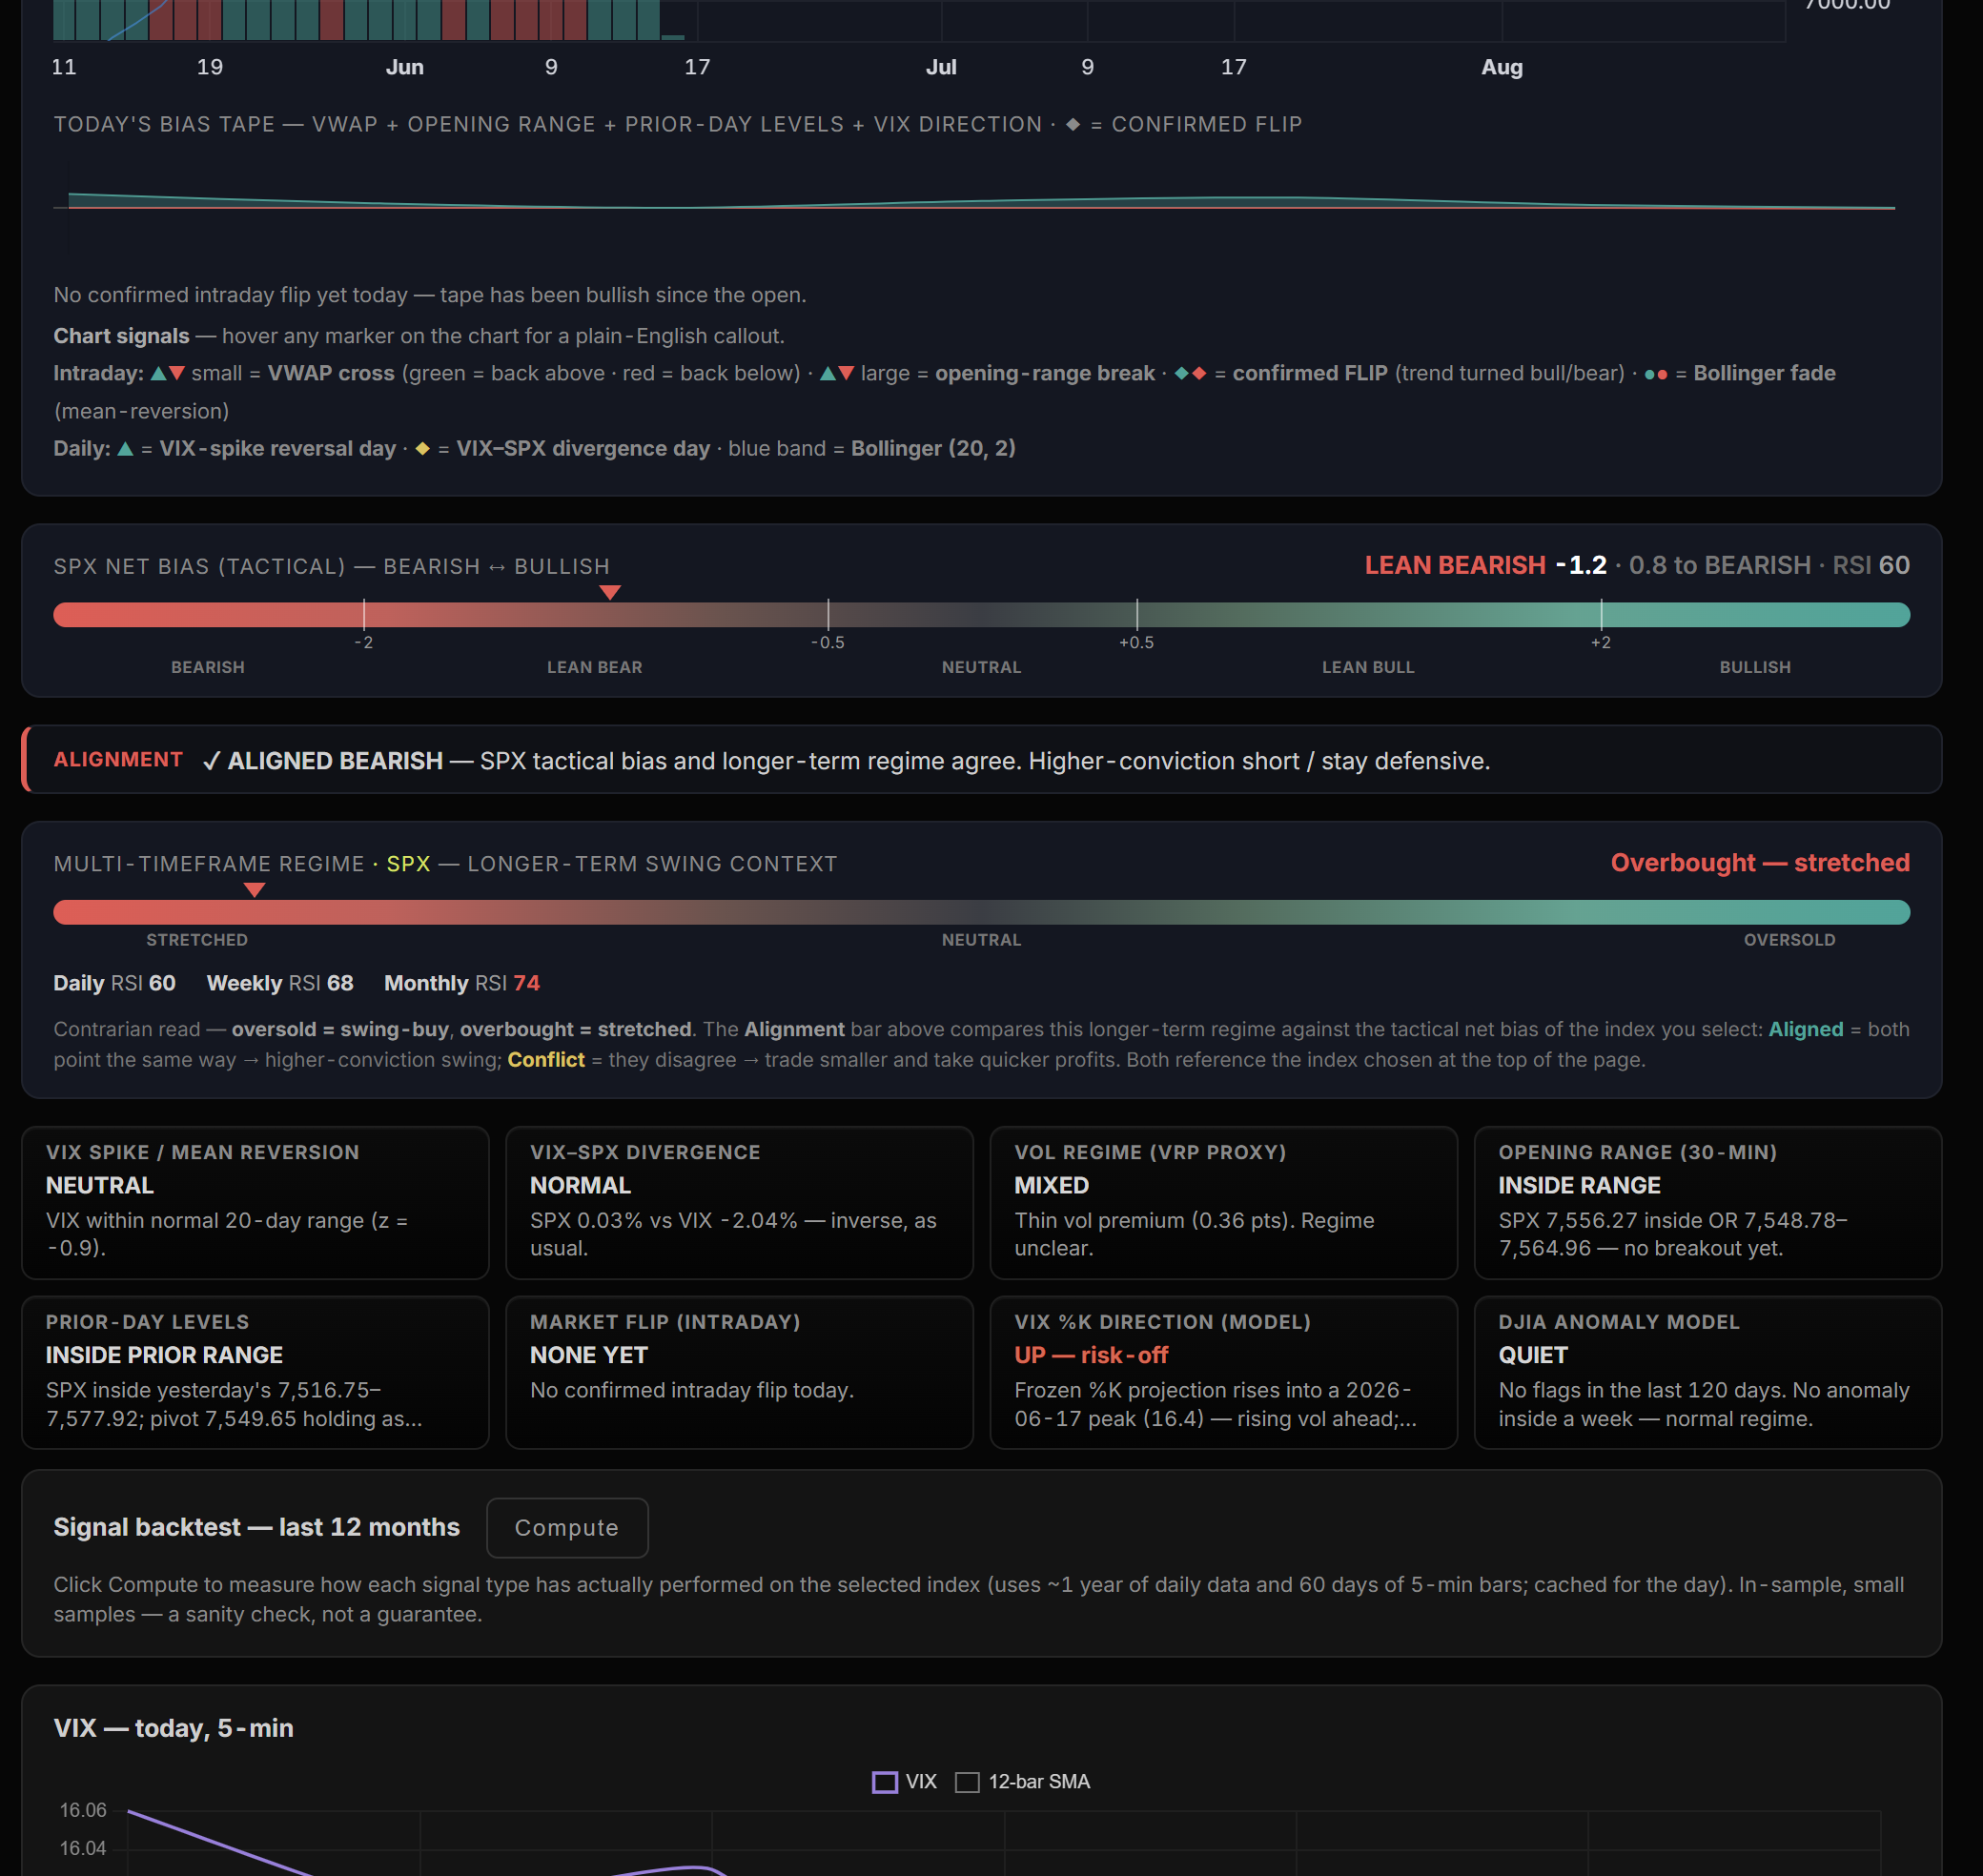
See the projected path — and the turn
The Kellan Projection (%K) maps the path price is likely to follow, with projected peak and trough dates and target bands — across the S&P, Nasdaq, VIX, gold, crude, rates, Bitcoin, semis and more. This is the intelligence the rest of the terminal is built on. It’s our own method, developed over the past eleven years and named for its creator — it’s unrelated to the stochastic oscillator’s %K.
- Forward projected path with peak/trough timing
- Run %K on any symbol, on demand
- Feeds the Net Bias read, with a published track record
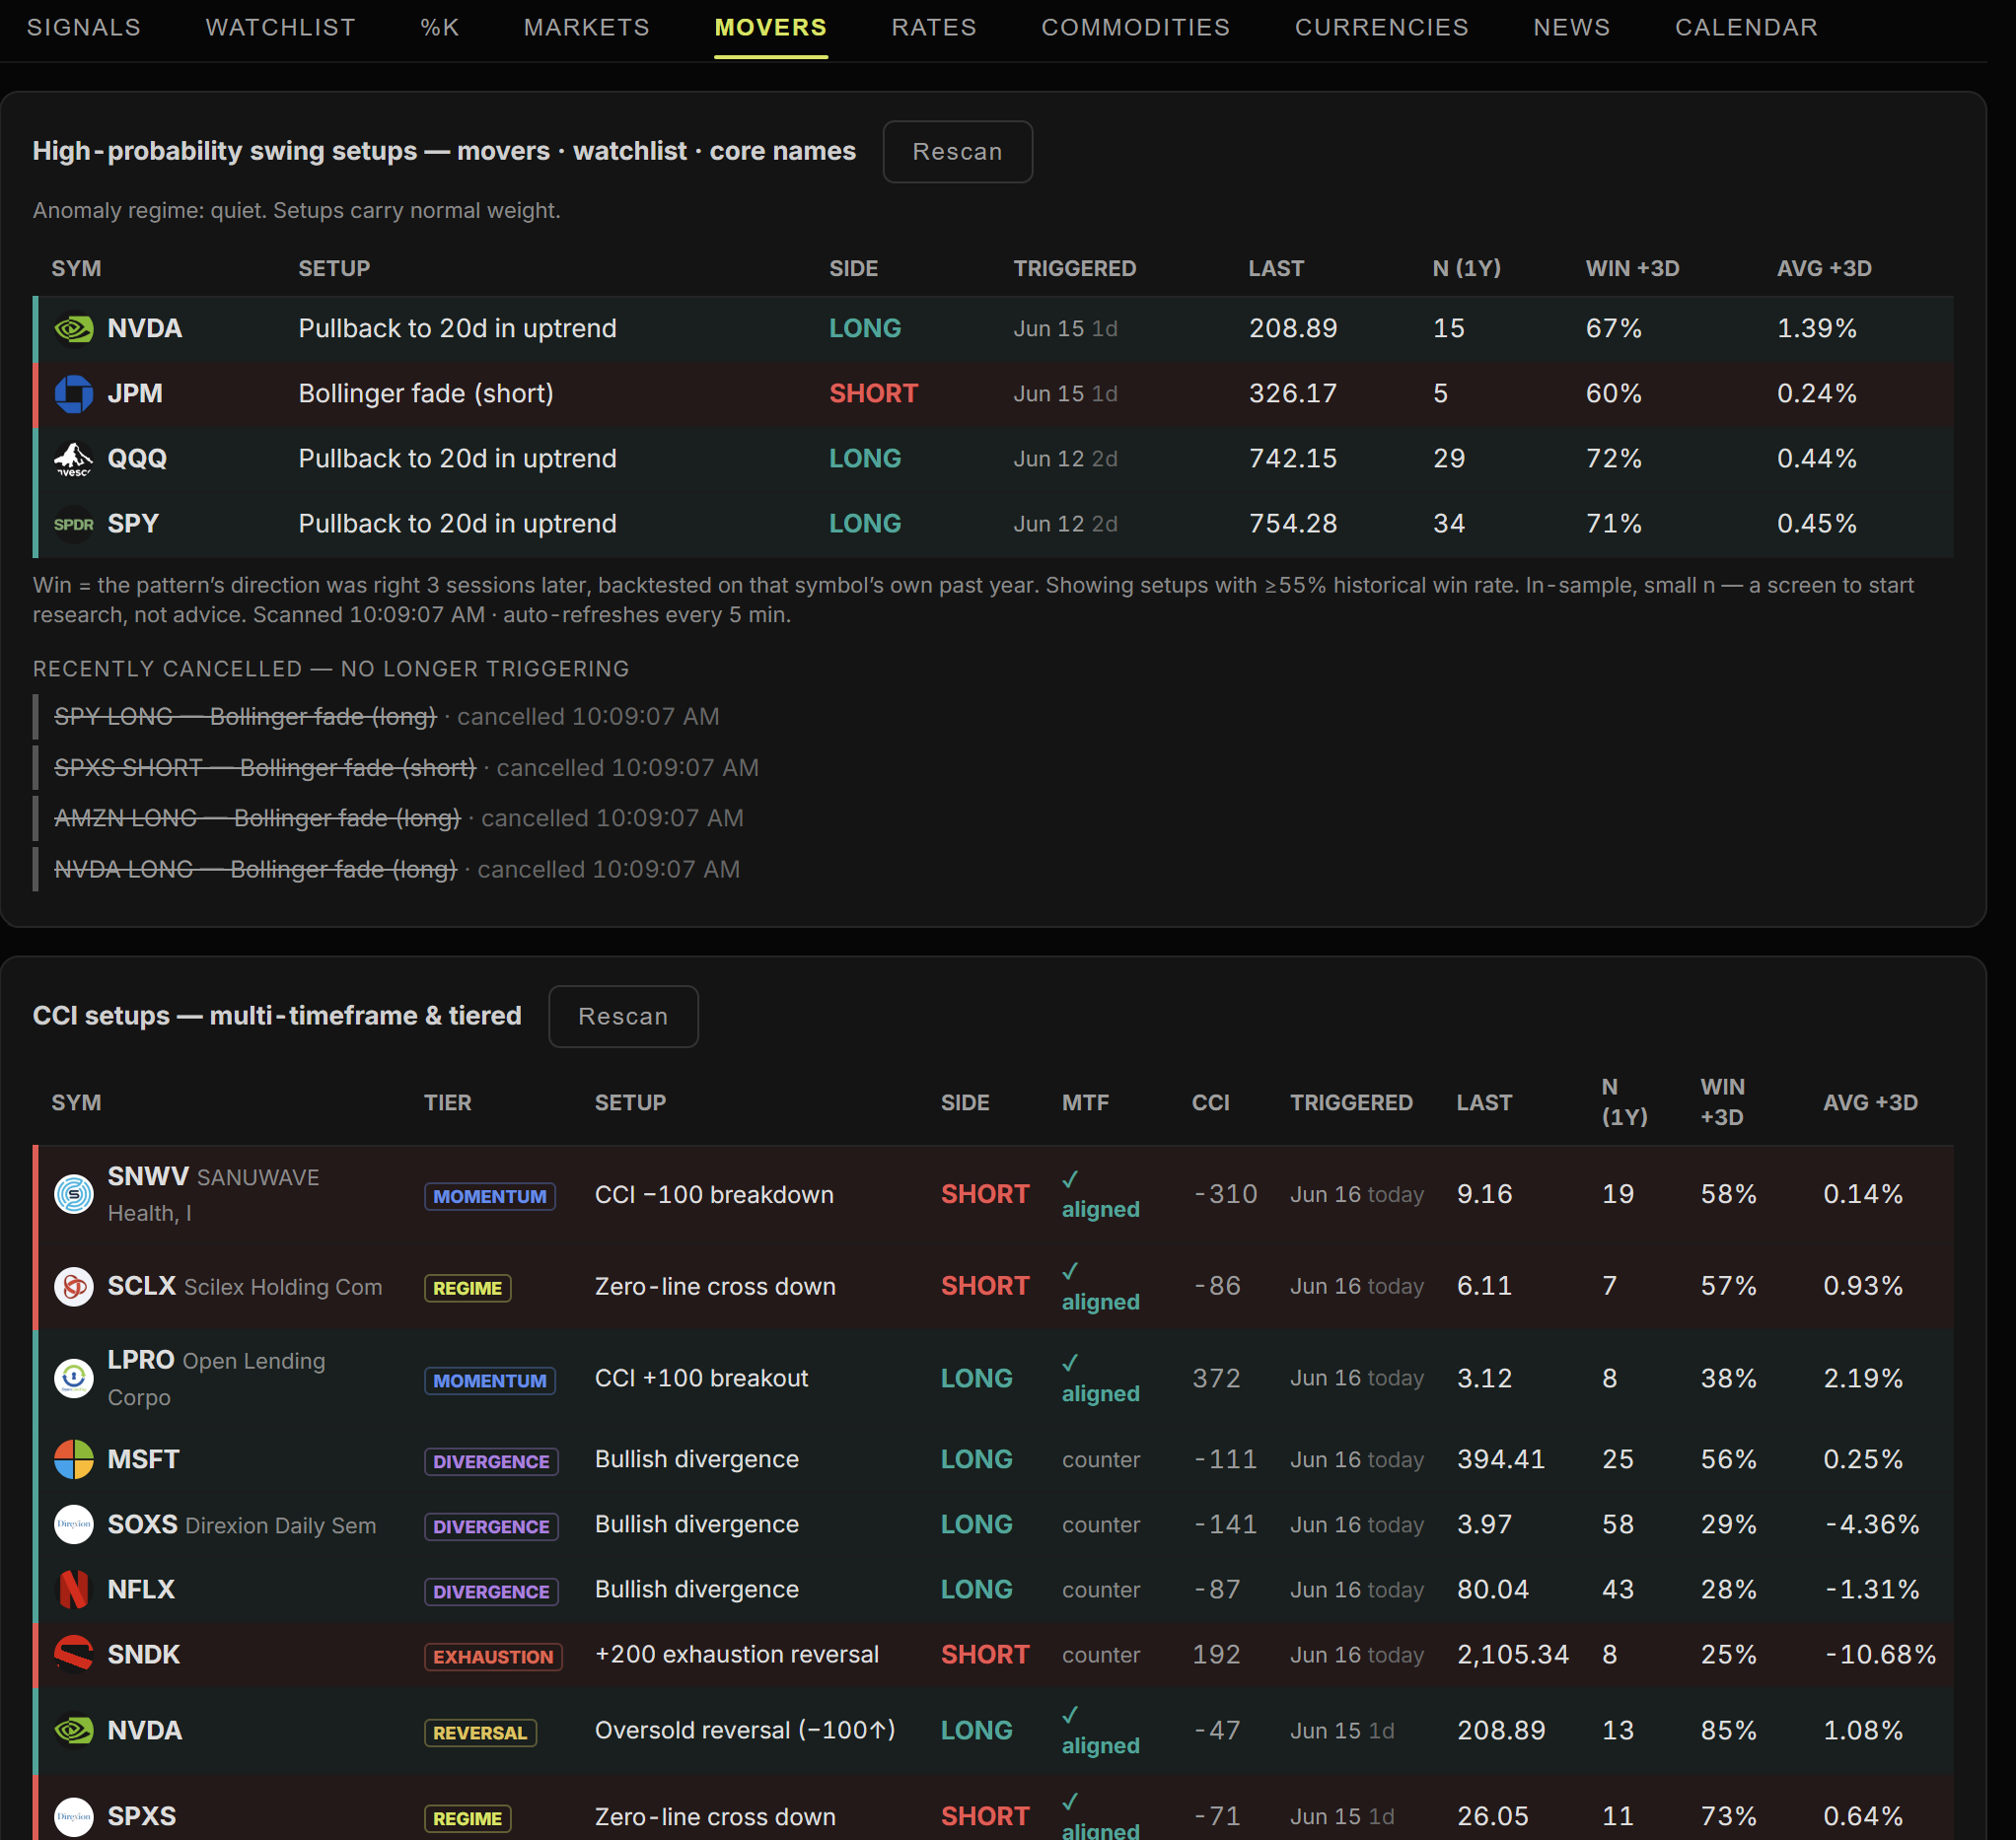
Find the trade, not just the data
The Movers scanner surfaces high-probability swing setups and a tiered CCI scanner across movers, your watchlist and core names — each with a backtested win rate on that symbol's own history and a multi-timeframe confluence check.
- Ranked setups with backtested win rate & average move
- Multi-timeframe CCI confluence
- Side that agrees with your Net Bias, highlighted
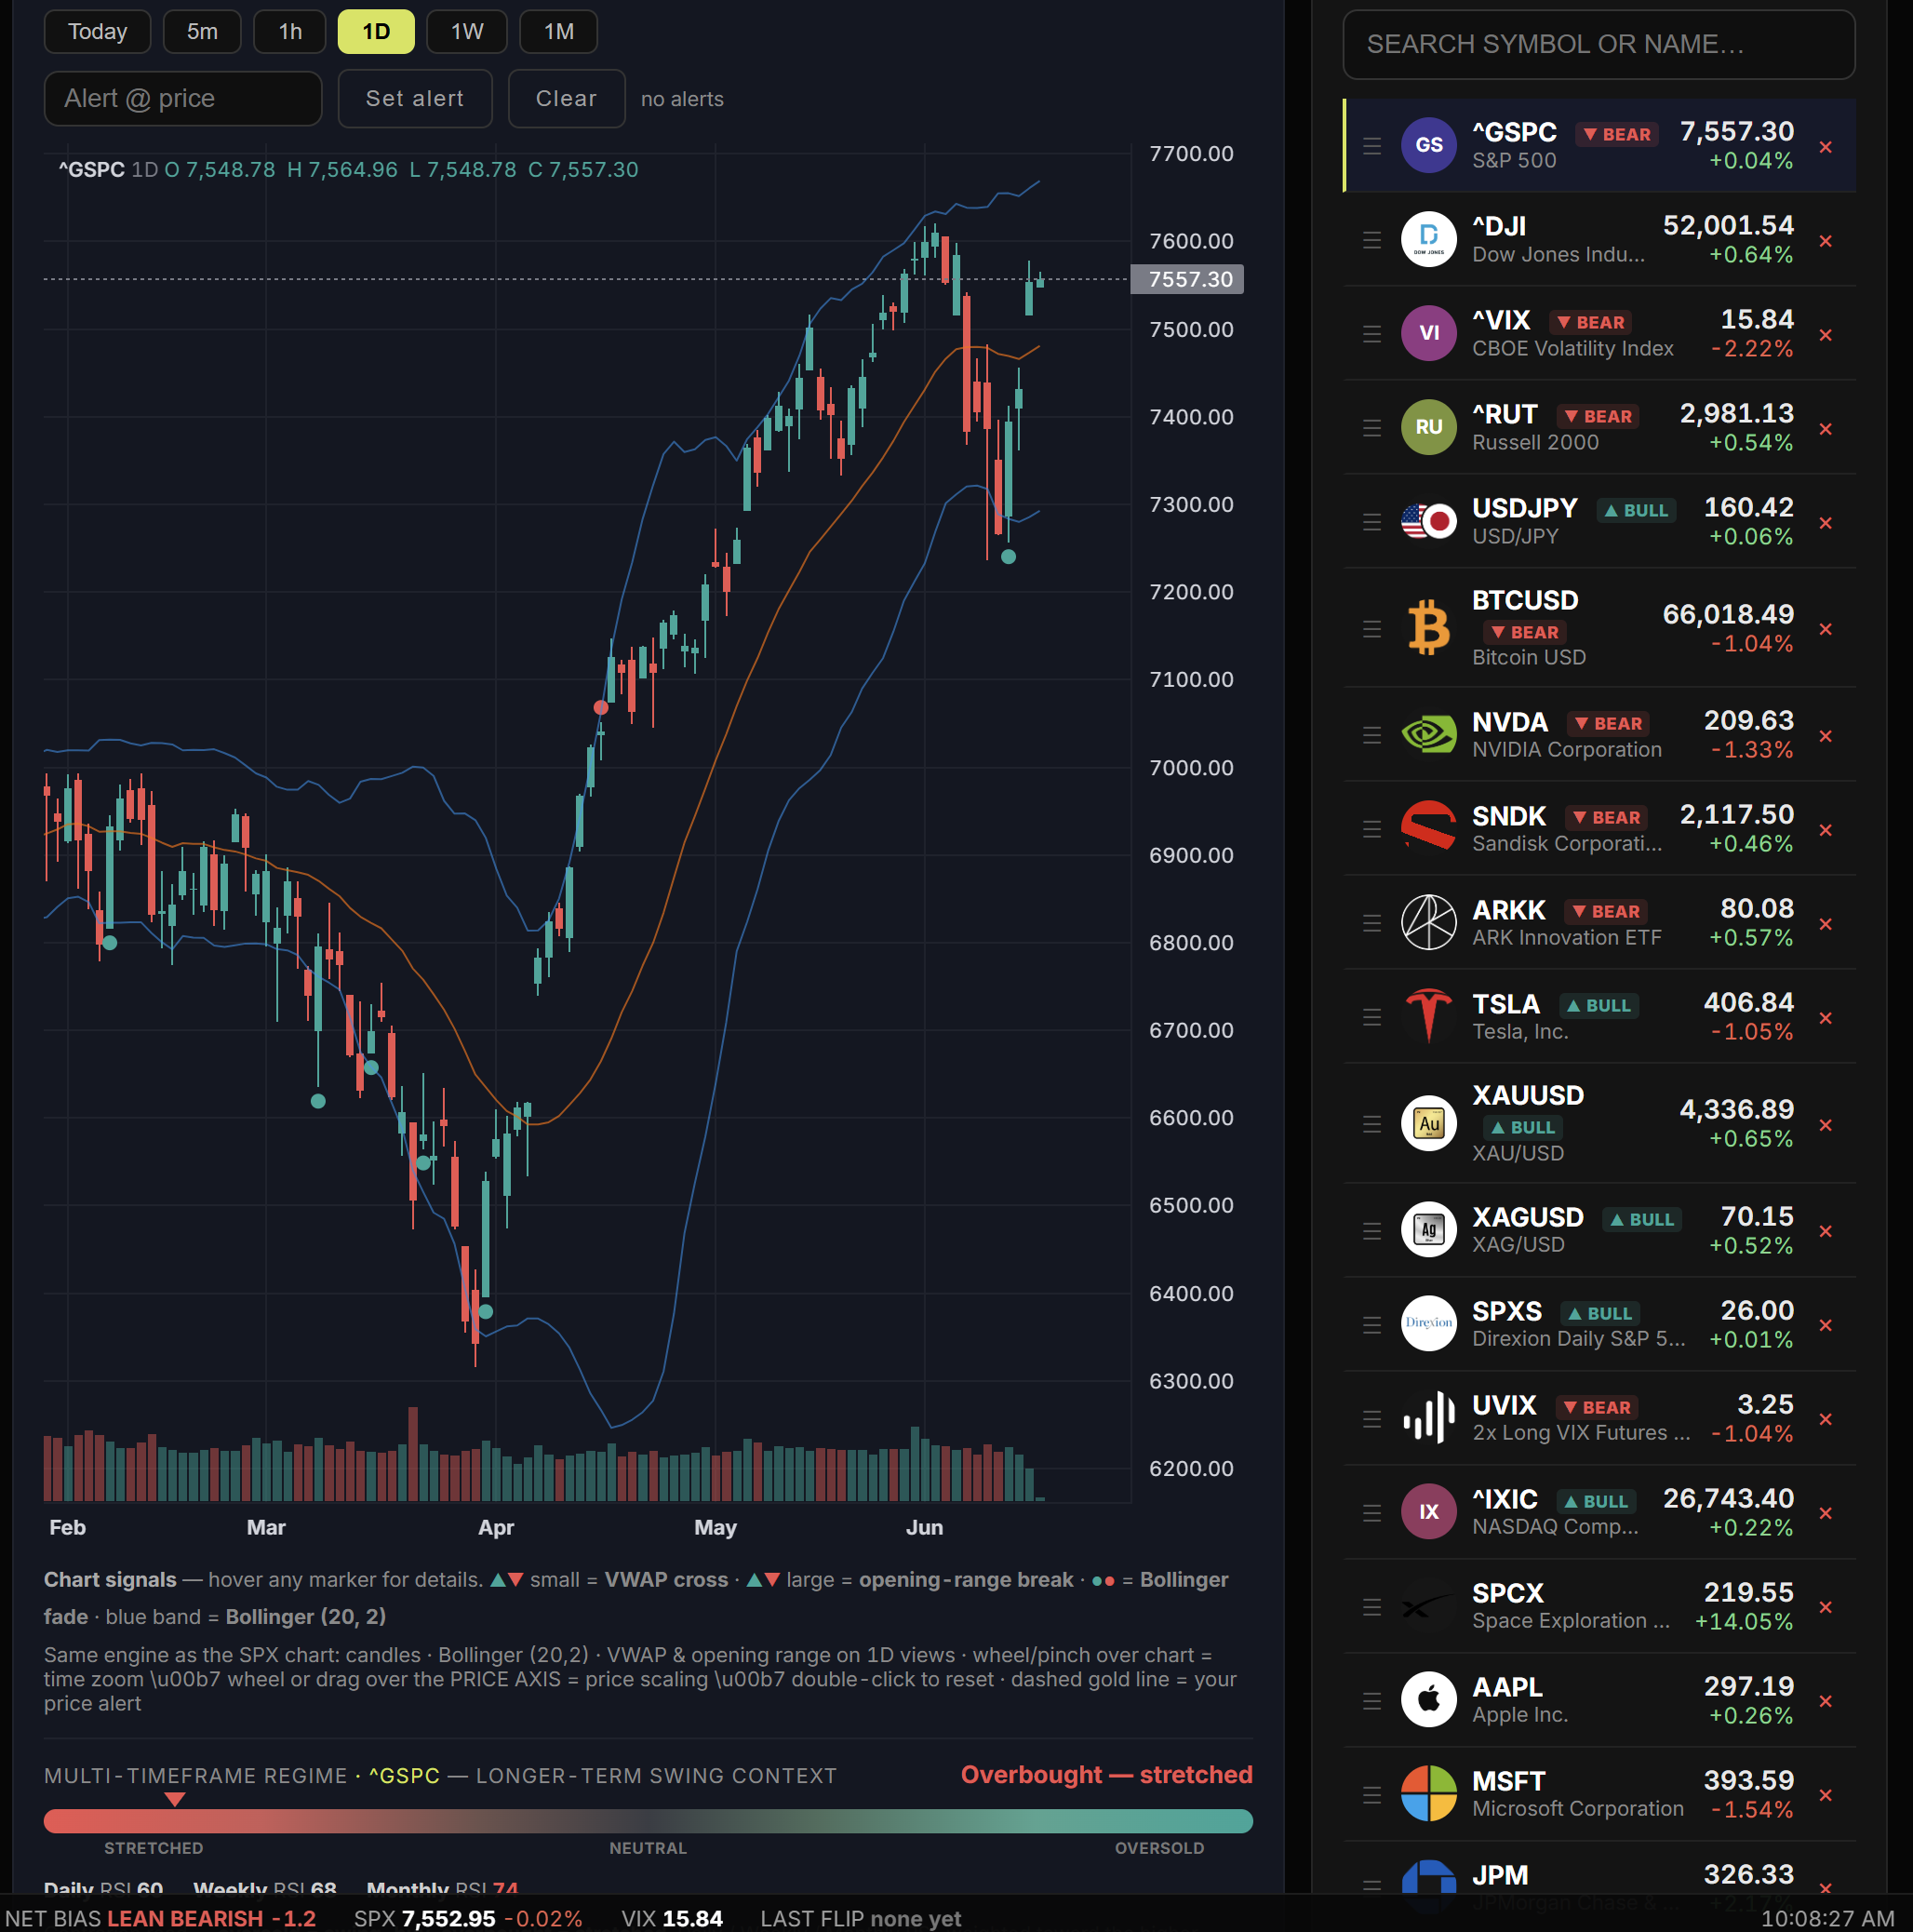
Your names, with momentum at a glance
Track any symbol with live quotes, a bull/bear flip badge for instant momentum reads, per-symbol charts and regime context, and price alerts — all synced to your account across devices.
- Flip badges flag momentum shifts early
- Per-symbol charts + regime gauge
- Cloud-synced price alerts
Never get blindsided by an event
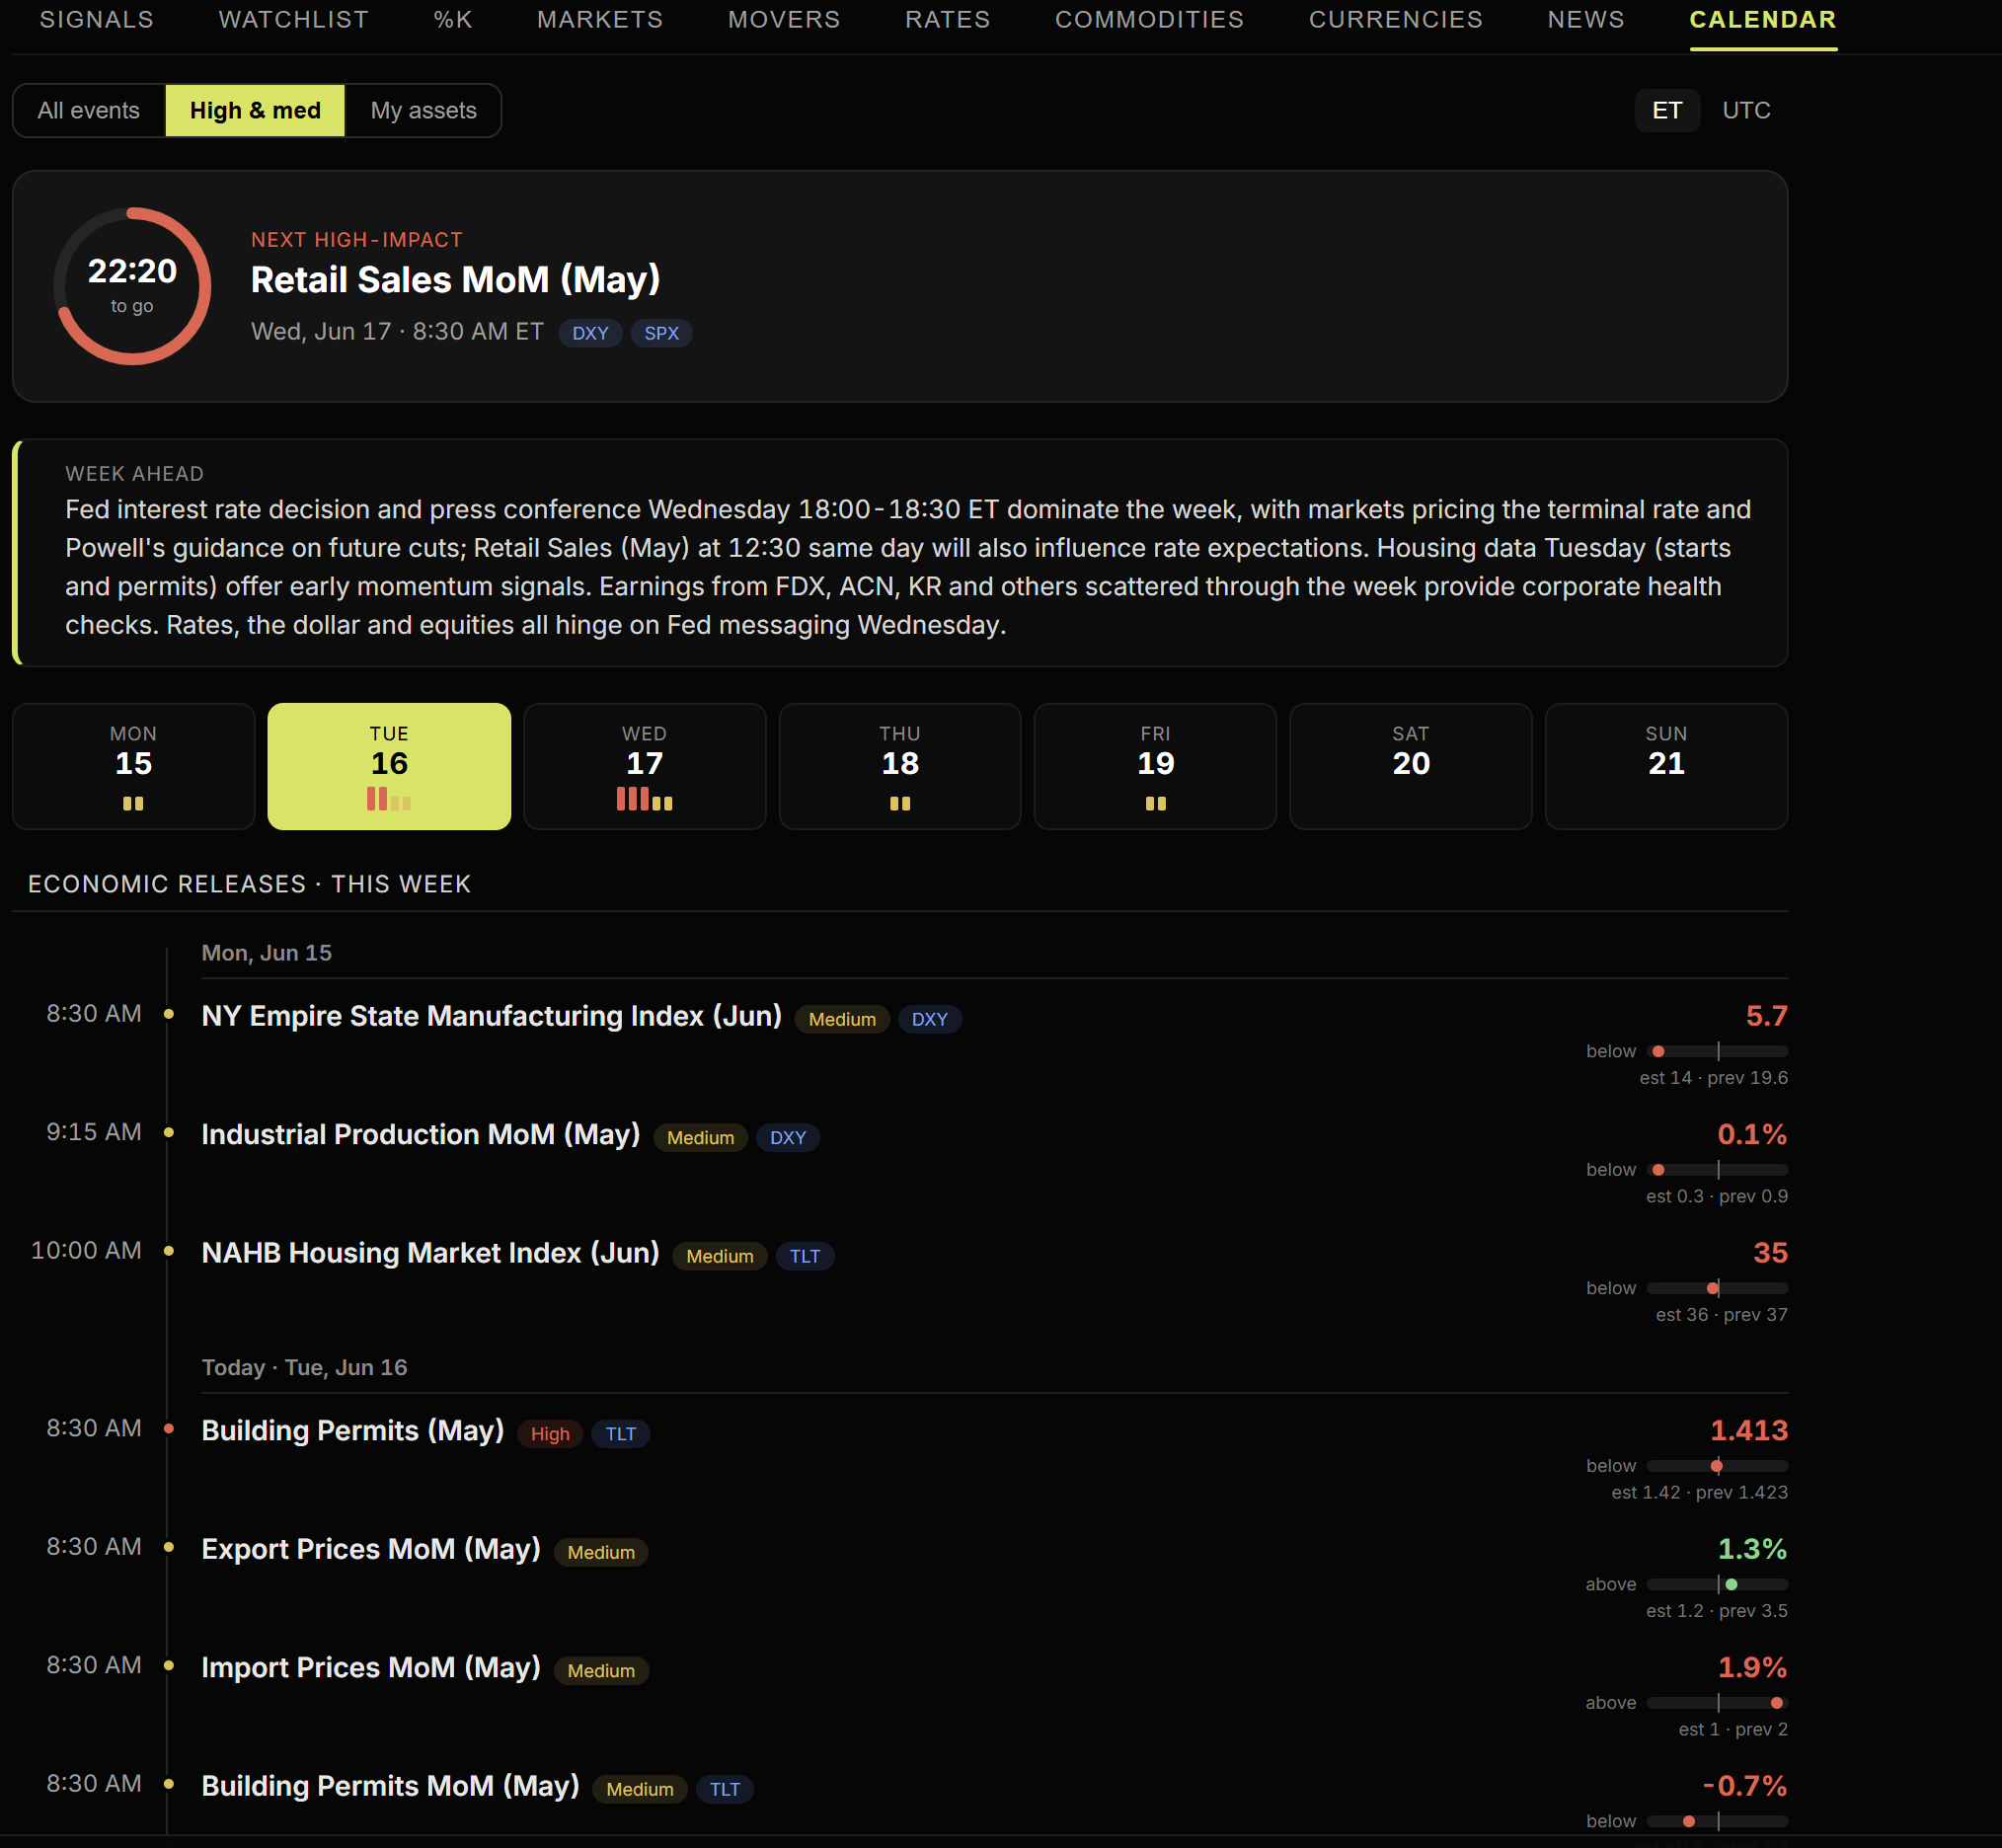
A live economic calendar with a countdown to the next high-impact print, an AI-written week-ahead summary, color-coded releases (good vs bad for the economy), and the assets each event moves.
- Countdown to the next market-moving event
- AI week-ahead summary
- Color-coded prints with affected assets
From read to action — with sizing
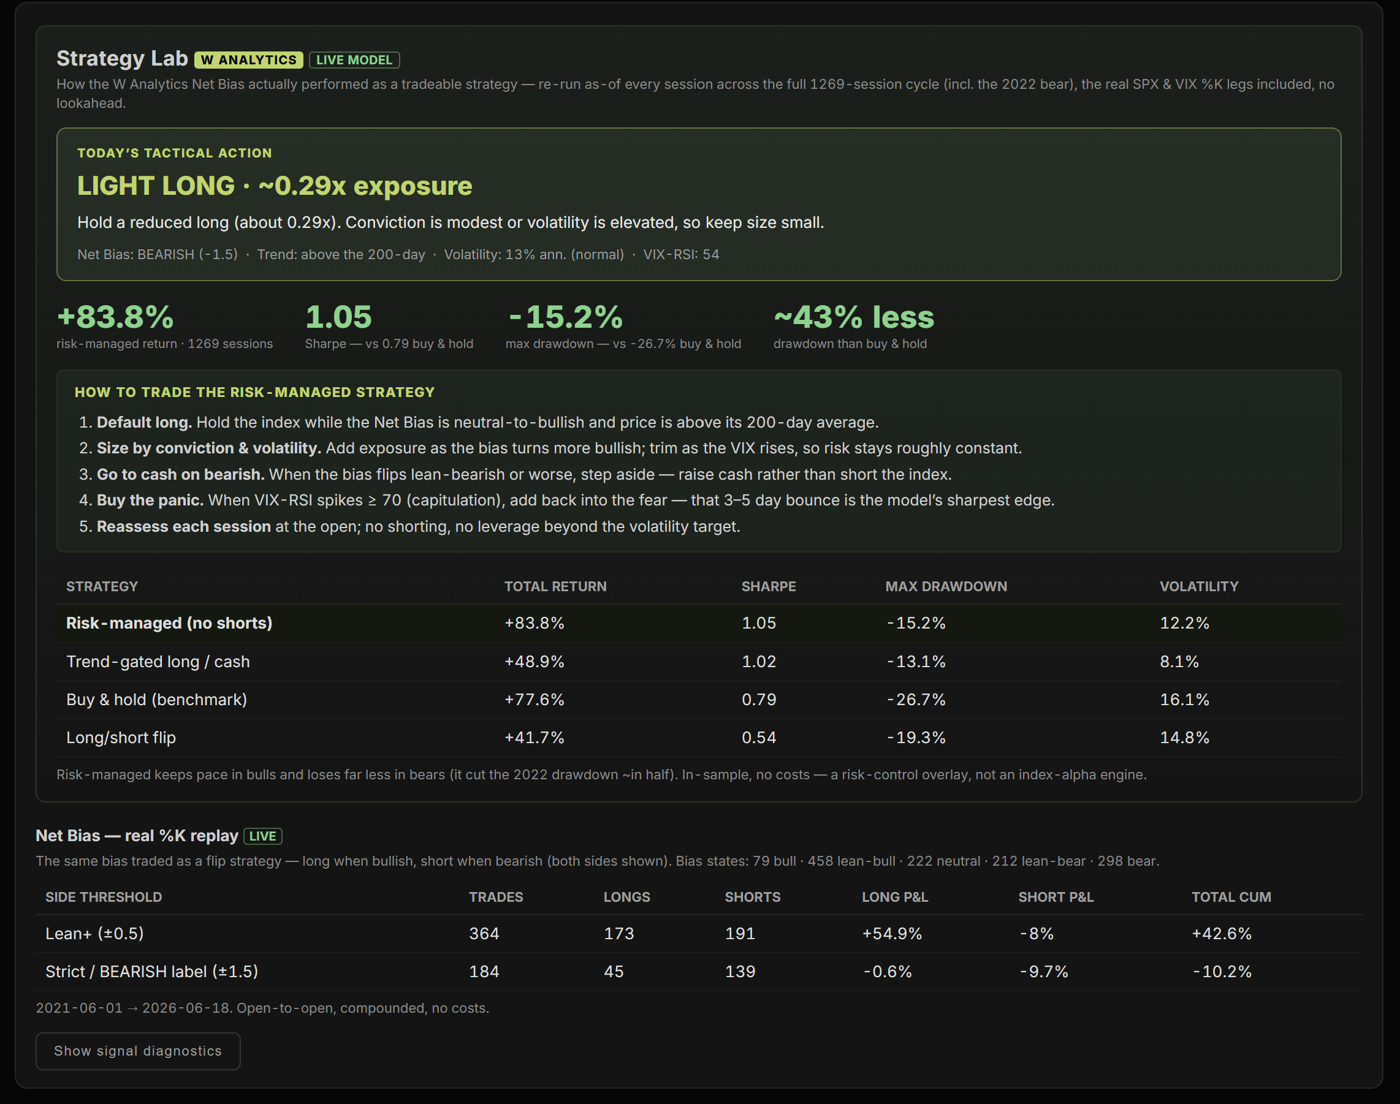
The Strategy Lab shows how the Net Bias actually performed as a tradeable, risk-managed strategy — re-run as-of every session across a 1,269-session cycle (including the 2022 bear), no lookahead. Each morning it prints one instruction: long, light, or cash, sized to conviction and volatility.
- Risk-managed +83.8% vs +77.6% buy & hold — at ~43% less drawdown
- Sharpe 1.05 vs 0.79 · max drawdown −15.2% vs −26.7%
- A plain “today’s tactical action” with exposure size
Walk in already briefed
A daily Market Brief, written for you each morning from the models’ read — where price is likely headed, when to expect the turn, and the cross-asset context. The prep work, done before the open.
- Model-driven, plain-English, every morning
- Peak/trough timing and target bands across assets
- Cross-asset context: equities, VIX, gold, rates and the dollar
Ask the terminal anything
The Ask-AI copilot answers from your terminal’s own signals, projections, brief and live quotes — not the open web. Ask about any symbol, signal or setup and get a grounded answer in seconds.
- Grounded in the terminal’s live data
- Explains the Net Bias, %K and Strategy Lab read
- One tap from anywhere in the terminal
Never trade the headline blind
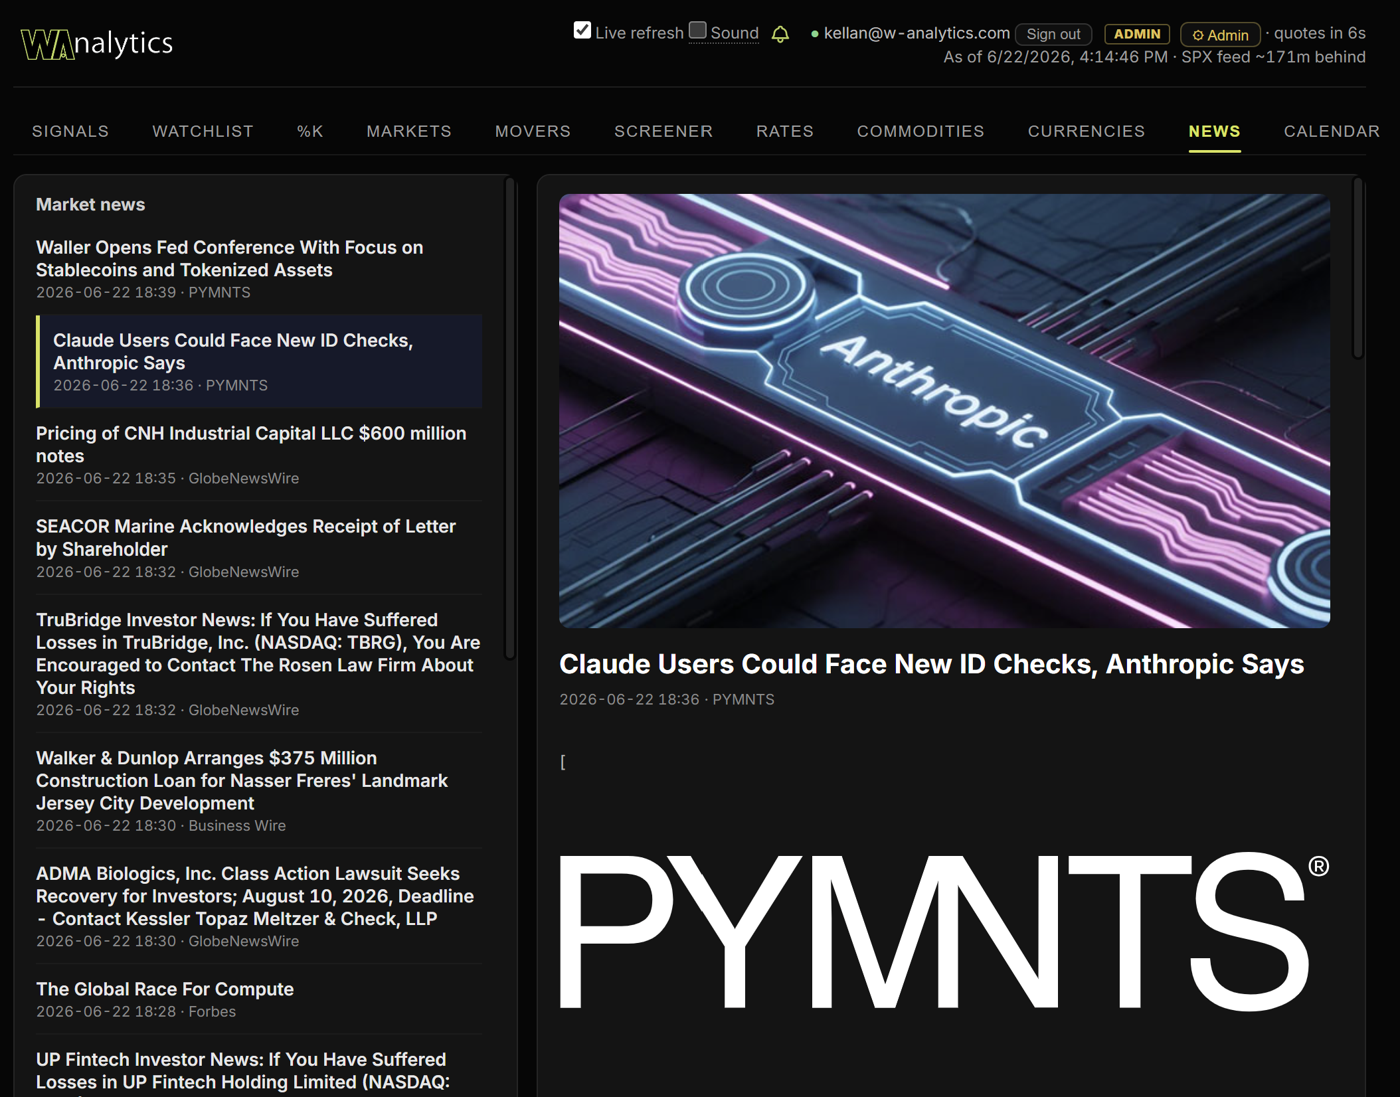
A live market-news feed with AI-written takes, so you see what’s moving and why — filtered to what matters for your names and the macro tape.
- Live headlines across your watchlist and the macro tape
- AI-written summaries on the stories that move markets
- Source and timestamp on every item
You’ll never be off sides
Push notifications and email alerts fire the moment the Net Bias flips, a new setup triggers, or a projected turning point lands — on your desktop or your phone, even when the terminal is closed. You don’t have to watch the tape; the move comes to you.
Built to be prescriptive, not reactive
Most platforms tell you what already happened. W Analytics tells you what's likely next — and what to do about it.
Proprietary models
The Kellan Projection (%K) engine is our own IP — forward paths, turn timing and target bands you can't get on mainstream platforms.
Signal, not noise
One Net Bias read, alignment checks and backtested setups replace a dozen scattered indicators with a clear, actionable lean.
AI that works for you
A daily market brief and week-ahead calendar summary, written for you each morning so you walk in prepared.
Never miss the move
Push notifications and email alerts fire on bias flips, new setups and projected turning points — so you’re never off sides, even when the terminal is closed.
Published track record
The Net Bias read is walk-forward tested back to 2021 and tracked live since June 2026. See the full record and judge the edge yourself.
Anywhere, instantly
Installable web app, cloud-synced watchlists and alerts. Open it on your desktop or phone and you're in.
One plan. The whole terminal.
Start with a 30-day free trial. Pro unlocks the full prescriptive engine — no gutted tier.
Pro
- The full Kellan Projection (%K) model library + %K on any symbol
- Live Net Bias regime + %K projection overlay
- Published track record, live since June 2026
- High-probability swing & CCI setups
- Anomaly detection + AI market brief
- Charts, watchlist, movers, rates, FX, commodities & news
- Off-screen alerts — push + email
Questions
What is the Kellan Projection (%K)?
The Kellan Projection (%K) is our own projection method, developed over the past eleven years and named for its creator. It’s unrelated to the stochastic oscillator’s %K. Instead of lagging indicators, it maps the forward path price is likely to follow, including projected peak and trough timing and target bands. It’s a core input to the Net Bias read, whose full walk-forward and live track record is published so you can audit the edge.
Is this financial advice?
No. W Analytics is a research and decision-support tool. Its signals, projections and backtests are informational, can be wrong, and are not personalized investment advice. Markets involve risk of loss — always do your own due diligence.
Can I cancel anytime?
Yes. Plans are month-to-month (or annual) billed securely through Stripe, and you can cancel anytime — you keep access through the end of your billing period.
Do I need to install anything?
No. The terminal runs in your browser and installs as an app on desktop or phone if you want one-tap access. Your watchlists and alerts sync to your account.
Trade with the path in front of you.
Open the W Analytics Terminal — start your 30-day free trial whenever you're ready.
Launch the Terminal